What does quality mean to you? Why and how is quality important to you? Find statewide and national resources here with facts and compelling statistics on the impact of Quality Counts on children, families, and early educators.
How can Quality Counts meet the county’s diverse needs?
Quality Counts California recognizes that, given the size of California and the diversity of its communities, a one-size-fits-all approach to improving program quality is not appropriate. So, while there are common elements across local quality rating and improvement systems (QRISs), such as the basic program standards used in assessing program quality, those developing and managing a QRIS have the flexibility to tailor quality improvement supports to their local needs.
How has Quality Counts California made an impact on quality early learning and care programs?
Since 1999, more and more states have been implementing statewide quality improvement initiatives. As of fall 2017, 42 states and districts had at least one quality improvement initiative, including QRISs (see Quality Compendium).
Since fall 2017, 43 out of 44 quality initiatives across the nation included information on quality improvement and recognition of the mission and goals of a QRIS. See an overview of QRIS mission and goals.
To help state and territory policymakers understand the costs associated with high-quality early care and education, the Office of Child Care’s National Center on Child Care Quality Improvement developed the Provider Cost of Quality Calculator.
What is the impact of Quality Counts California on the early learning system?
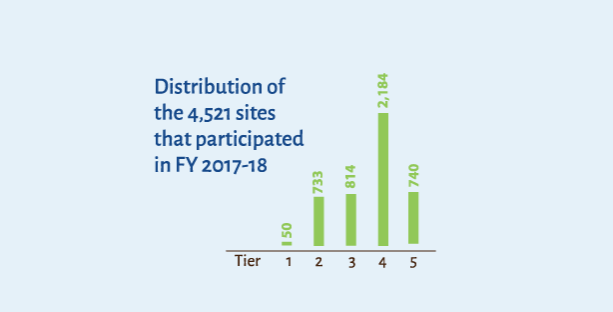
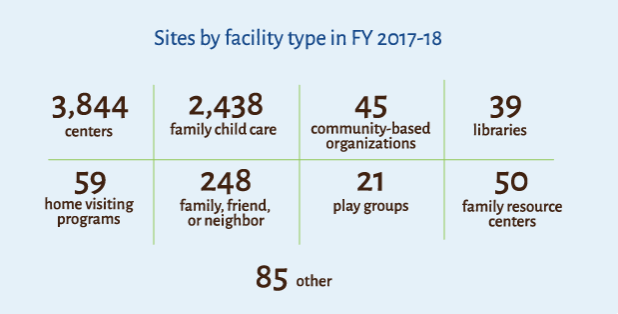
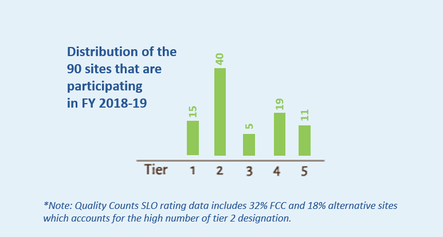
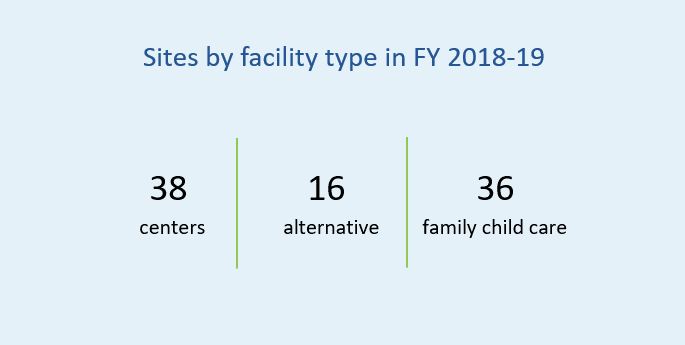
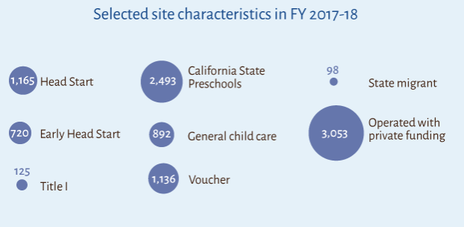
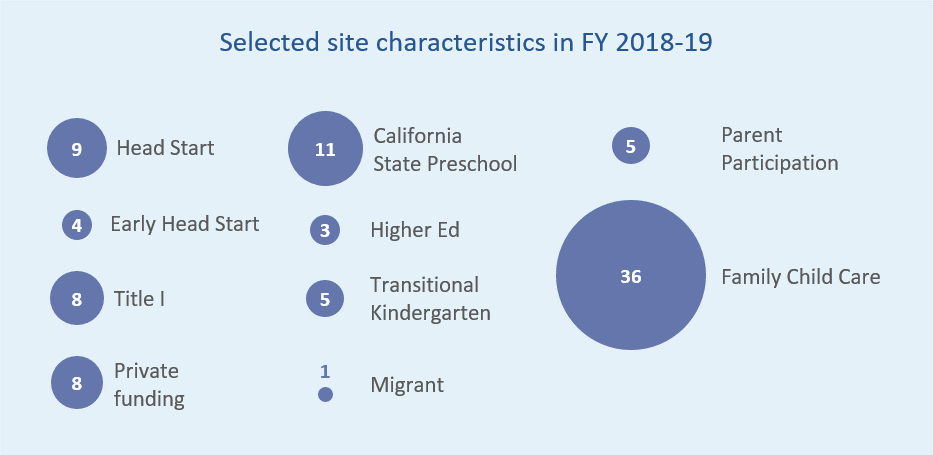
The statistics shown in the below infographics were drawn from the Quality Counts California data file, annual performance report for consortia, annual performance report for Regional Hubs, and partner survey.
Also included is complementary data on Quality Counts San Luis Obispo drawn from our online data system, iPinwheel.
Also included is complementary data on Quality Counts San Luis Obispo drawn from our online data system, iPinwheel.
Quality Counts CA data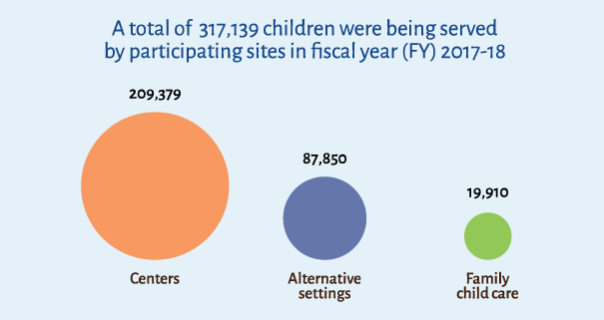
|
Quality Counts SLO data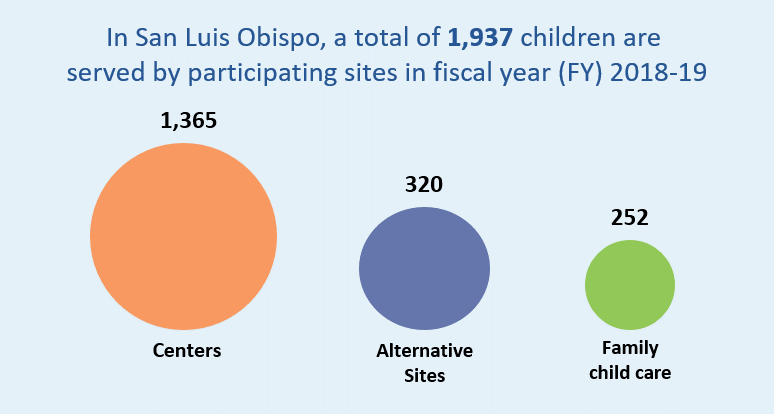
|
|
|
|
|